


When monitoring the quality of your products and processes, understanding the factors that influence outcomes is crucial. But how do you identify and optimize these factors to drive better results?
This is where Design of Experiments (DOE) comes into play. DOE is a statistical method that allows you to systematically plan, conduct, and analyze controlled tests to identify the optimal combination of variables that impact your desired outcomes. By integrating DOE with predictive analytics, you can take your quality improvement efforts to the next level.
DOE offers significant benefits, especially when you're dealing with complex systems where multiple factors interact. Unlike traditional methods that test one factor at a time, DOE enables you to manipulate several input variables simultaneously, revealing critical interactions that might otherwise be overlooked.
However, the success of a DOE largely depends on the planning phase. Unfortunately, many DOE initiatives falter before they even begin due to perceived obstacles such as high costs, complexity, or missing information. This is where predictive analytics can be a game-changer. By leveraging advanced predictive tools, you can overcome these challenges, streamline your DOE process, and significantly increase your chances of success.
This blog will explore how combining DOE with predictive analytics can help you optimize your processes and achieve better, data-driven results.
Overcoming Obstacles in Screening Designs with Predictive Analytics
Problem 1: You want to run a screening design, but you can’t stop a system (or process) to run collect data or collecting data is very costly.
Screening Designs of Experiments (Screening DOEs) are used by practitioners to identify the most important variables in a process from a field of many potential variables. They enable a practitioner to reduce the size of the experiment which saves time and money. This is especially true if data is difficult to acquire or is costly.
What happens when you can’t stop a system or process to run a screening experiment? Or if collecting data points for screening are so expensive that it makes it difficult to justify doing?
Solution 1: Predictive analytics can help you easily identify the most important variables.
Have no fear, predictive analytics are here! By analyzing data from your system or process you can leverage your favorite machine learning algorithm or run automated machine learning to identify the potentially impactful predictors to your response. Minitab makes this simple through our relative variable importance chart built specifically to help you identify the most important variables. Check out our webinar, DOE in Practice, linked below to an example.

Did you know you can drive better results combining DOE and Predictive Analytics?
Watch our free webinar "DOE in Practice” where our expert Jim Oskins details the planning, design and analysis of factorial designs.

Addressing Uncertainty in Setting Factor Ranges with Predictive Analytics
Problem 2: You want to run a Designed Experiment, but aren’t confident about the proper range (i.e. upper and lower limits) for your factors (i.e. levels).
When running DOEs, the experiments are run at different factor values, called levels. These are the levels are the independent variables for which we measure a response, which we traditionally call your dependent variable. As an example, if you’re trying to optimize the speed of a piece of equipment, you need to set the limits of the highest and lowest speed to build a range of speeds to optimize your process. Another example might be temperature of an oven if you’re baking a cake. Based on your experience, you may know that below 300F won’t bake the cake and at 400F you’ll burn it, so you can set your limits. But what if you’ve never baked a cake before? Or what if you have a new machine so you don’t know where to set your limits?
Solution 2: Predictive analytics provide visualizations to help you set reasonable limits.
When you run Minitab’s predictive analytics, you will generate visualizations which demonstrate the effect that one or multiple variables have on the predicted outcome. For predicting outcomes, the purpose of these plots is to highlight whether or not the relationship between the response and a variable is linear, monotonic or more complex. These visualizations are also extremely useful for DOEs.
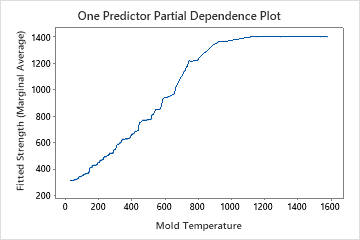
In the example above, let’s assume you were trying to run an experiment that optimizes strength. You may understand that there is a relationship between mold temperature at strength, but also know that simply turning the machine to the highest temperature could have adverse effects like overheating or increasing the cost of production unnecessarily. You also know there might be interactions with other variables in the experiment (e.g. pressure). By looking at the graph you get insight that temperature above 1200 results in marginal increases in strength. For your designed experiment, you may set your mold temperature levels to 1000 and 1200 to run an experiment where the goal is to maximize strength. However, if the goal was to minimize strength, you can see from the plot that testing at a lower range of mold temperatures would be more reasonable.
Integrating Predictive Analytics with DOE for Optimal Results
Predictive analytics are just one of the many tools that go hand-in-hand with DOEs.
DOEs are critical tools for many practitioners and should not live in a silo. As mentioned, planning is critical to the success of a DOE, which is why Minitab created a DOE Planning Worksheet built specifically to help the planning process. If you're new to DOEs or simply looking to improve your skill set, Minitab provides the support, resources, and solutions to help you on your way.
Ready to Optimize Your Experiments? Connect With Us Today.
