Juicy, butter roasted turkey.
Steaming mashed potatoes.
Tangy cranberry relish.
Delicious candied sweet potatoes.
Creamy green bean casserole.
Sweet and airy corn bread.
Silken pumpkin pie.
The traditional Thanksgiving menu has so many mouth-watering dishes on the table, you don’t know where to start.
If you savor statistics as much as food, you might feel similarly as you gaze at all of the delicious analyses on Minitab’s Regression menu:
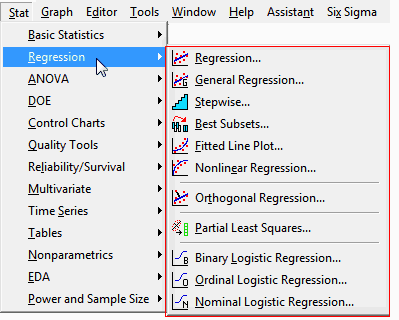
How can you decide which regression analysis to choose? In this post, I’ll give you some bite-sized samples of each regression dish to help you decide which one to heap on your plate.
Regression with a Categorical Response
Ever notice the horizontal divider lines on the Minitab menus? Those are not just to prevent our programmers from writing crooked. Think of them as the separators on a paper plate that keep your cranberry sauce from running into your mashed potatoes, so they don’t mix together and turn pink.
For example, the line at the bottom of the menu neatly separates all the regression analyses that have a categorical response variable.

To use one of these analyses, each response in your data must fall into a separate category. Choose between them based on what kind of categorical response you have. Here’s a concrete scenario:

Binary Logistic Regression: The response falls into one of two categories.
Example: You track whether each person took an antacid after Thanksgiving dinner or not (Yes or No)

The odds of a person taking an antacid increases, on average, 2.35 times with each helping of candied sweet potatoes.
__________________________________________________________
Ordinal Logistic Regression: The categories of your response can be ordered from least to greatest.
Example: You record how many belt buckle notches each person expanded their belt after dinner (0-4 notches)

On average, each additional helping of mashed potatoes results in a 36% increase in the odds that you will expand your belt by another notch.
__________________________________________________________
Nominal Logistic Regression: The categories of your response do not follow an order.
Example: You ask each person which of these animals they most feel like after Thanksgiving dinner: A beached whale, a sea elephant, or an anaconda after swallowing a wild pig.

With each additional serving of turkey, people are 4.37 times more likely to feel like an anaconda after swallowing wild pig than a beached whale.
__________________________________________________________
Regression with a Continuous Response
The line at the top of Minitab's Regression menu neatly separates regression analyses that use a continuous response variable.
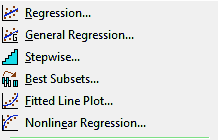
To use one of these analyses, each response must be a measurement on a continuous scale, such as length, weight, or time.
__________________________________________________________
Regression: You have one or more continuous predictors, and a continuous response.
Example: You track how many minutes each person spends laying belly-up on the living room floor after Thanksgiving dinner.

Each additional helping of chestnut stuffing results in an increase of 4.28 minutes, on average, of laying belly-up on the living room floor after dinner (when the servings of all of the other dishes are held constant).
__________________________________________________________
General Regression: You have a mix of categorical and continuous predictors, and a continuous response.
Example: Besides the continuous predictors for the helpings of each dish, your model for belly-up time also includes a categorical predictor to indicate whether each person ate snacks before the Thanksgiving meal (Yes or No).
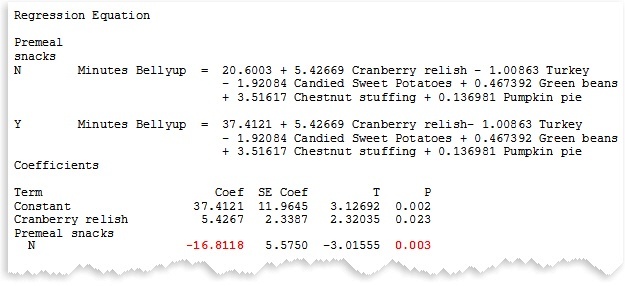
Eating snacks before the Thanksgiving meal increases the time spent bellyup on the floor by about 17 minutes, on average, when the helpings of all of the other dishes are held constant.
__________________________________________________________
Stepwise Regression: Minitab identifies a useful subset of predictors based on the statistical significance of the predictors (using stepwise, forward selection, or backward elimination)
Example: You want Minitab to tell you which dishes have a statistically significant effect on the number of minutes people spend belly-up on the floor after dinner.
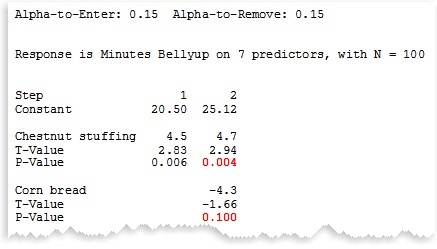
Of the 7 dishes on the table, Minitab determines that chestnut stuffing and corn bread are the statistically significant predictors for evaluating time spent belly-up on the floor.
__________________________________________________________
Best Subsets Regression: Minitab identifies a useful subset of predictors based on how much variation the model explains (the maximum R-squared criterion).
Example: You want Minitab to tell you which combination of dishes explains most of the variation in the number of minutes people spend belly-up on the floor after dinner.
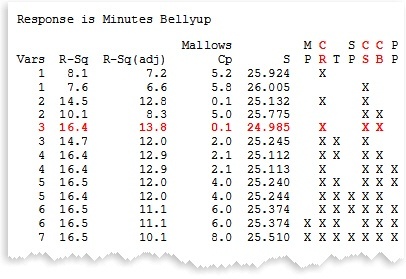
Of the 7 predictors in the model, cranberry sauce (CR) chestnut stuffing (CS), and corn bread (CB), explain the most variation in time spent belly-up on the floor. Adding more predictors (dishes) doesn’t increase the R-squared value significantly.
__________________________________________________________
Fitted Line Plot: Display a fitted line and perform regression and for only one continuous predictor and a continuous response.
Example: You want to visualize the association between servings of stuffing and time spent belly-up on the floor.
There’s a weak but statistically significant quadratic association between servings of stuffing and time spent belly-up on the floor.
__________________________________________________________
Nonlinear Regression: Specify a nonlinear function to model the relationship between continuous predictors and a continuous response.
Example: Uncle Alfred, a brilliant Ph.D. chemist, has conducted experiments on the chemical properties of chestnuts and their effect on metabolic enzyme reactions that induce fatigue. Based on his research, he knows he can model the relationship between servings of chestnut stuffing and post-prandial prostrate position using a Gompertz growth curve with three parameters.
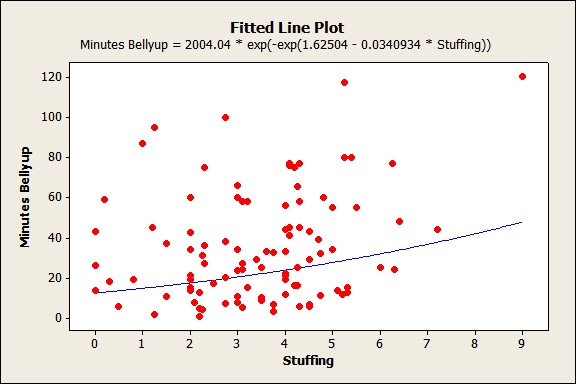
Uncle Alfred’s theoretical exponential function of a negative exponential function describes the relationship between chestnut stuffing and belly-up time. However, Uncle Alfred is the only one who understands his complex nonlinear model. When tries to explain it after dinner, everyone falls asleep on the floor. Belly-up.
Specialized Regression Analyses

Two analyses on the Regression menu each form their own category. These analyses model a continuous response and continuous predictors, but their applications are specialized.
Orthogonal Regression: Test whether two instruments or methods provide comparable measurements.
Example: Grandma got a new digital turkey thermometer for a gift, but she’s suspicious that it doesn’t work as well as her trusty old metal thermometer. Before Thanksgiving, she tests it by using both thermometers to measure the temperature in a pot of water as she chills it in the fridge or heats on the stove, recording the temperature measured on each instrument.

Despite Grandma’s suspicions, the digital thermometer is equivalent to her tried-and-true metal thermometer. (The confidence interval for the slope includes 1 and the confidence interval for the constant includes 0.)
__________________________________________________________
Partial Least Squares Regression: You have few observations relative to the number of predictors, or your predictors are highly associated with each other, making a standard regression analysis problematic.
Example: Suppose your Thanksgiving study sampled only 10 subjects, instead of 100 subjects, but still included all 7 predictor variables. Your small sample caused high standard error for the coefficient estimates. Also, the same people who took many helpings of chestnut stuffing also took many helpings of mashed potatoes and turkey, and had similar responses with more helpings (zzzzzzz....) causing these predictors to be correlated.
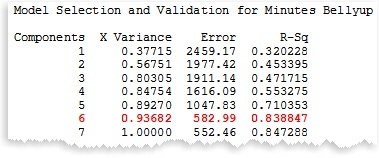
By using a partial least squares model with 6 components, each formed by taking a linear combination of the predictor variables, you can explain about 84% of the variation in belly-up time. Adding another component doesn’t increase R-Sq much.
__________________________________________________________
Whew! Are you feeling stuffed after sampling all that regression? It may take awhile to digest everything on that menu. If it's too much, I suggest you loosen your belt a notch and lay on the floor for a while.
Belly-up.


