


When it comes to exploring the wonders of nature and planning your next adventure, having the right information at your fingertips is essential. If you’re asking yourself “which national park should I visit?” you’re in the right place. Whether you're an avid hiker, a wildlife enthusiast or simply someone who appreciates the beauty of natural landscapes, national parks offer a treasure trove of experiences waiting to be discovered.
But how do you choose which national park to visit? How can you compare them based on their unique characteristics? How can you best visualize all this data?
Enter Minitab—powerful statistical software that can provide visual insights and help you make informed decisions. In this blog post, we'll delve into the exciting task of exploring national parks and uncover interesting ways to visualize some of the most important factors to consider before your visit. For this analysis, we considered the top ten most frequently visited national parks, which are: The Great Smoky Mountains, Grand Canyon, Zion, Rocky Mountain, Acadia, Yosemite, Yellowstone, Joshua Tree, Cuyahoga Valley and Glacier.
We'll weigh variables that play a significant role in shaping the visitor experience in these frequently visited parks: average temperature, total acres, annual visitors and the distance to the nearest national park so you can make the most of your vacation. By examining these factors, we can gain a deeper understanding of the parks' distinct qualities and determine which one aligns best with your preferences.
FIRST FACTOR: WEATHER/TEMPERATURE
Perhaps the most important factor to consider is what the weather will be like during your visit since nearly all national park-related activities take place outdoors. Our initial investigation uncovered that, overall, the hottest top ten park is Joshua Tree and the chilliest, unsurprisingly, is Glacier.
But what if you want to plan a trip for a specific time of the year? Maybe you want some time to unwind after the holidays in January or after the kids go back to school in September?
With Minitab, you can easily visualize the hottest, coolest and most comfortable time of year with our (no pun intended) heatmap:

With this resource, you can see that the hottest month is July in Joshua Tree with a high of 103, and the coldest is December in Rocky Mountain with an average high temperature of 25 degrees Fahrenheit.
More importantly than the extremes, you can see how each of these parks compare to one another—all in one simple graph. You can see that Acadia is comfortable for summer travel while Yosemite, Cuyahoga and The Great Smoky Mountains are all fantastic options for an autumn trip.
Or, if you are looking for which parks are the most desolate at a certain time of year, a bubble chart can contextualize this information for you with ease:
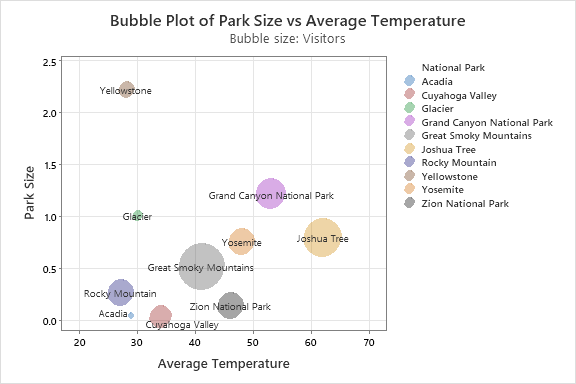
Here, we see that in January, the least visited national park is Acadia (more room to explore!) and the busiest is The Great Smoky Mountains.
SECOND FACTOR: TOTAL ANNUAL VISITORS AND TOTAL ACReS
Second to poor weather, traffic congestion and overcrowding can detract from the national park experience.
Generally, most travelers visit national parks during the summer months, but the data you've acquired above reveals that every season holds the potential for a delightful experience.
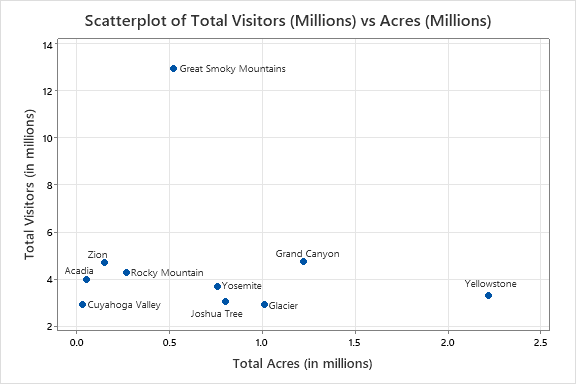
Using Minitab’s scatterplot, you can compare the total number of visitors based on the acreage of each national park. The findings indicate that The Great Smoky Mountains have the highest probability of overcrowding with nearly 13 million annual visitors and a relatively low land area, while Yellowstone has average visitation but plenty of room to roam and explore:
THIRD FACTOR: PARK SYNERGY
Let’s face it: we would all love to spend more time on vacation. Life is busy and it is difficult to unplug and get out into nature. That’s why it’s so important to make the most of our time away from the office or home.
Though we only examined the top ten national parks based on visitation in this analysis, there are fifty-three other spectacular parks for you to explore. Wouldn’t it be great if you could visit more than one park on your summer (or autumn, spring or winter) vacation?
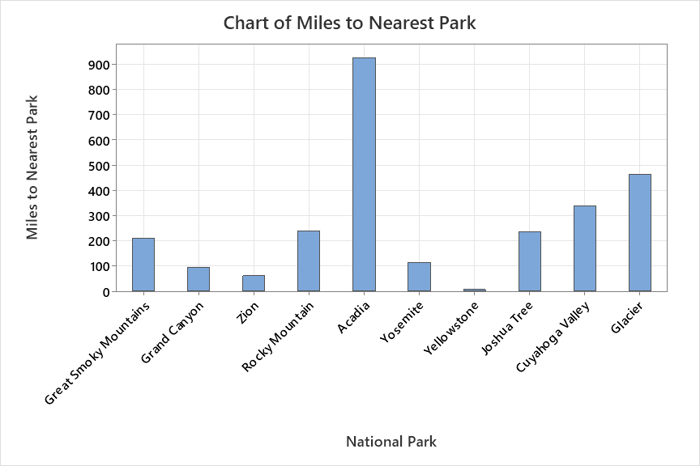
Minitab makes it easy for you to visualize this, too. With our bar chart, we can see that Yellowstone is your best option if you want to synergize your visit with Grand Teton (only a 6.5 mile drive). Acadia, however, is isolated—it would take you almost two full days to drive to the nearest national park (Cuyahoga Valley). Zion, Grand Canyon, Yosemite and The Great Smoky Mountains all have another beautiful park within a half-day drive.
CONCLUSION
We can’t tell you where to go or fully predict what the weather will be like, but we can help you visualize your next travel excursion.
With tools like DOE, ANOVA, Regression or even our powerful Predictive Analytics Module, Minitab has the power to give you the information you need to solve your most pressing business (or personal, or travel!) challenges. And the Minitab suite of products can help keep your data current with Minitab Connect, or give you the tools you need to collaborate effectively with Minitab Workspace. Additionally, check out our training options.
Ready to Explore the Possibilities?
Sources: National Park Service, NOAA