


When you analyze a Gage R&R study in statistical software, your results can be overwhelming. There are a lot of statistics listed in Minitab's Session Window—what do they all mean, and are they telling you the same thing?
If you don't know where to start, it can be hard to figure out what the analysis is telling you, especially if your measurement system is giving you some numbers you'd think are good, and others that might not be. I'm going to focus on three different statistics that are often confused when reading Gage R&R output.
The first thing to look at is the %Study Variation and the %Contribution.
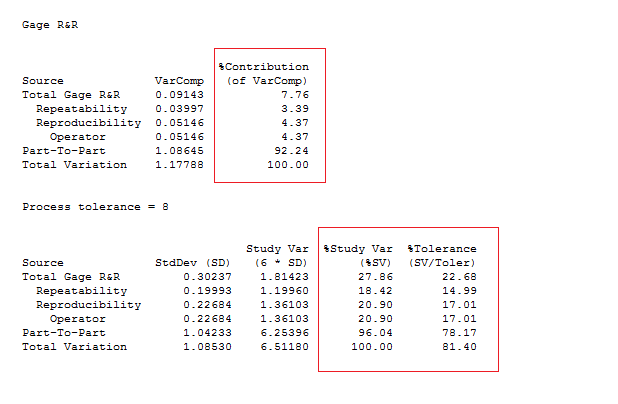
You could look at either of them, as they are both telling you the same thing, just in a different way. By definition, the %Contribution for a source is 100 times the variance component for that source divided by the Total Variation variance component. This calculation has the benefit of making all of your sources of variability add up to 100%, which can make things easy to interpret.
The %Study Variation does not sum up to 100% like %Contribution, but it does have other benefits. %Contribution is based on the variance component that is specific to the values you observed in your study, not what the population of values might be. In contrast, the %Study Variation, by taking 6*standard deviation, extrapolates out over the entire population of values (based on the observed values, of course).
The bottom line is that both % Study Variation and %Contribution are telling you, in simple terms, about the percentage of variation in your process attributable to that particular source.
What about %Tolerance? What does that allow us to look at? While %StudyVar and %Contribution compare the variation from a particular source to the total variation, the %Tolerance compares the amount of variation from a source to a specified tolerance spread. This can lead to seemingly conflicting results, such as getting a low %StudyVar while having a high %Tolerance. In this case, your gage system may be introducing low levels of variability compared to other sources, but the amount of variation is still too much based on your spec limits. The %Tolerance column may be more important to you in this case, as it's more specific to your actual product and its spec limits.
So, a short summary:
%Contribution: The percentage of variation due to the source compared to the total variation, but with the added benefit that all sources will sum to 100%
%StudyVar: The percentage of variation due to the source compared to the total variation, but with the added benefit of extrapolating beyond your specific data values.
%Tolerance: The percentage of variation due to the source compared to your specified tolerance range.
The %StudyVar is perhaps more reliant on having a good quality study and can be used when your goal is improving the measurement system. On the other hand %Tolerance can be used when the focus is on the measurement system being able to do it’s job and classify parts as in or out of spec.
Each of these statistics provide valuable information, and how you weigh each of these largely depends on what you're looking to get out of your study.