


The Assistant in Minitab Statistical Software includes Design of Experiments (DOE). We already spent some time looking at 5 highlights when you create a screening experiment with the Assistant in Minitab.
But the Assistant can also help you make sense of the data you collect for your experiment. After you create a design with the Assistant, choose Assistant > DOE > Analyze and Interpret and you’re on your way. Exactly what you get depends on which type of design you’re analyzing, but there’s some really neat stuff to help you get the most out of your data. Here are 3 highlights:
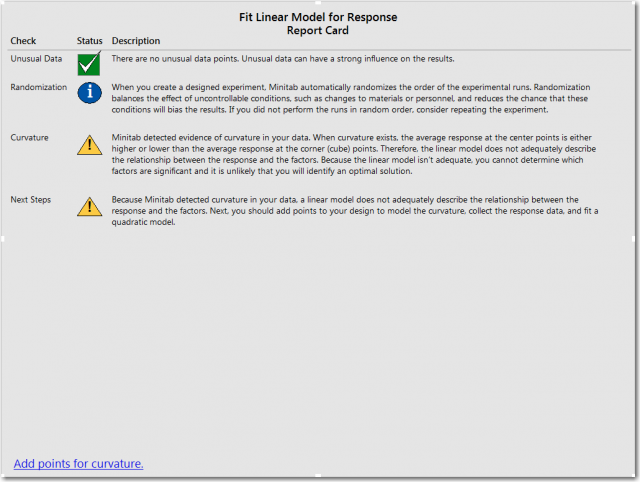
1. Next Steps
After you analyze the data from your design, the next question is often what you should do based on the results. Because the answer depends on your results, so does the Next Step that the Assistant suggests in the Report Card.
For example, when you analyze a screening design, the advice differs based on the number of significant factors. The goal of the screening design is to identify the 2 to 5 factors that have the greatest influence on the response. If you identify zero or one significant factor the Assistant suggests how to collect more data to identify significant factors. If you identify 6 or more significant factors, the Assistant suggests how to choose which factors to include in a modeling experiment so that you can identify the settings that produce the best value for your response variable. If you fit a linear model and there is no significant curvature, the Assistant suggests confirmation runs on the optimal response settings. If you fit a linear model and there is significant curvature, then the Assistant suggests that you collect more data so that you can model that curvature.
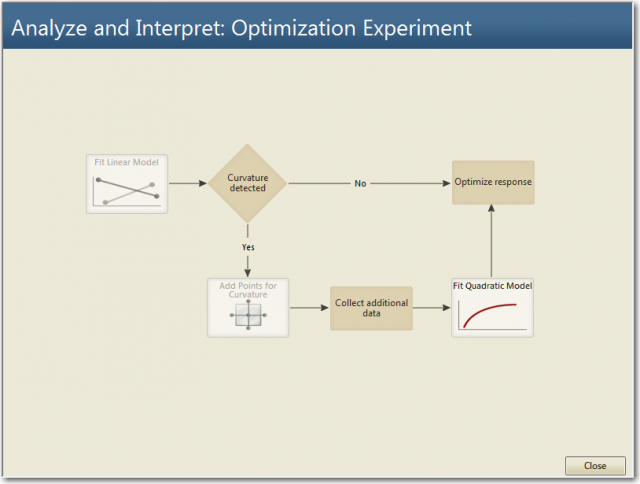
2. Guided Analysis Path
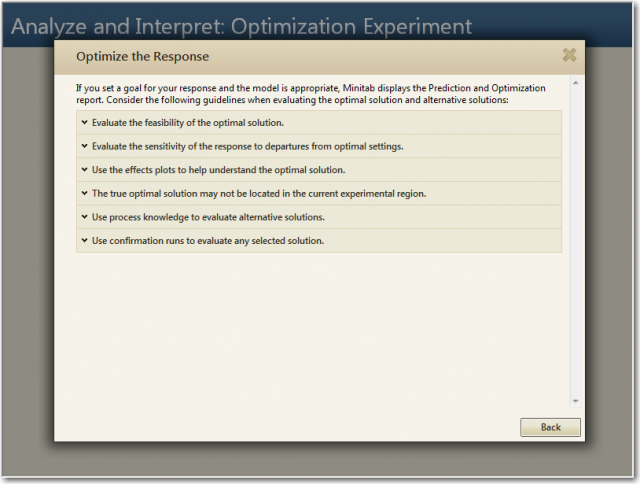
Although the Next Steps are convenient, one of the great things about the Assistant is the flow charts that guide you at just the right time. For example, when you choose to analyze and interpret a modeling design, the flow chart shows fitting a linear model. If you want to know more about the issues that will arise when you are ready to optimize the response, then you can click the Optimize response rectangle in the flow chart to get the information that you need.
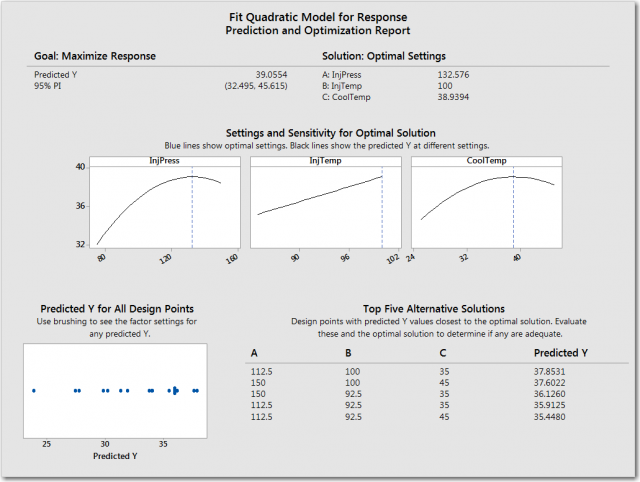
3.Optimal Settings
When you analyze a modeling design, the Assistant asks you about your goal for the response variable. If the Assistant finds that your modeling design fits the data, then you get the Prediction and Optimization report. The best part about the report is that it tells you the settings that best achieve your goal for the response. If you want to maximize the response, the settings that maximize the response are in the report. If you gave a target value, the settings that get closest to the target are in the report. And if, for any reason, the optimal settings are undesirable, then you get the next 5 best combinations of settings to help you find a way to meet your goal.
Designed experiments are a powerful tool to help you get the most information from the least amount of data. With DOE in the Assistant in Minitab, it’s easier than ever to create, analyze, and interpret designed experiments. Try it out for yourself and you’ll be one step closer to performing fearless data analysis.