Last time, we talked about what resolution means in design of experiments (DOE). After you choose your resolution in Minitab Statistical Software, you need to choose the number of center points and the number of replicates for corner points. We can consider these two questions together because they’ll help determine the total size of the experiment.
Using center points to check your model
I alluded to center points when we talked about 2-level designs previously. Center points are experimental runs with the all of the continuous factor settings set halfway between the low level and the high level. Center points tell us if the linear assumption that we use for a 2-level design is true. If the effects are linear, then we’ll be able to draw a straight line from one level of the factor, through the center point, to the other level of the factor. If the linear assumption isn’t true, the center points let us know that we need a to switch to a response surface design to get a good model.
Using center points and replicates to increase power
Including and replicating center points has a second purpose in design of experiments—the same purpose that replicating the corner points has: we can see how much variation there is in how far the gummi bears go when we replicate the same settings for the factors. The question of how many times we need to replicate the center points or the other (corner) points is a question of statistical power. Power is the probability that an we find an effect that really is statistically significant, so more is better.
Let’s take a look at some Minitab output to see what happens when we change the number of replicates and the number of center points using a 5-factor 1/4 fraction design as an example. Remember that when we discussed blocks, I suggested that we do only one replicate per catapult, so I'll use the same number of blocks and replicates.
- Choose Stat > Power and Sample Size > 2-Level Factorial Design.
- In Number of factors enter 5.
- In Number of corner points enter 8.
- In Replicates enter 4.
- In Power values enter 0.8.
- In Number of center points per block enter 2 3 4.
- In Standard deviation enter 1.
- Click Design.
- In Number of blocks, enter 4. Click OK in both dialog boxes.

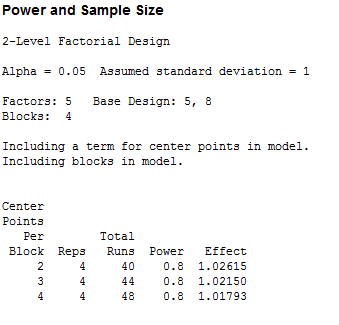
Minitab's results show that with 4*8 = 32 runs and 8 center point runs, for a total of 40, we can reliably detect an effect size of 1.02615 inches.
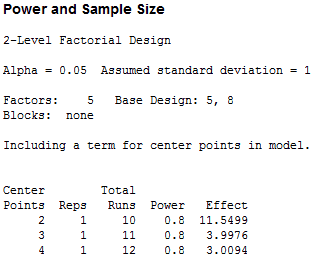
What if we did a smaller design? Repeat the above steps, but change the number of replicates and the number of blocks to 1. I got these results:

With 1 replicate and 2 center points, for 10 runs in all, we can reliably detect an effect that is 11.5499 inches. The smaller the effect size you can detect in your experiment, the better. That’s a pretty big reason to add some replicates!
You can also see what the center points do to the detectable effect size. When there are 4 replicates of the corner points, adding a few more center points doesn’t make a big difference. When you have no replicated corner points, then adding only 2 more center points reduces the effect size you can detect from an effect that is over 11.5 to an effect that is nearly 3. That’s a pretty big reason to have center points as well!
In my next post, we’ll estimate the standard deviation for the gummi bears from historical data. Then, using that standard deviation, we'll look at how many replicates of our gummi bear experiment we want.


