


We’ve used design of experiments to look at the data. We’ve seen that the center points are statistically insignificant. We’ve seen that blocks help account for the unstable conditions during the collection of the data. Now for the exciting part: let’s choose a model to use to predict where the gummi bears will land when we launch them.
Various criteria exist for how to choose a model, so we’re not going to settle on a single model right away. We’ll do three steps:
- Come up with some candidate models.
- Check for reasons to discard the candidate models.
- Check how the models perform when we go back and shoot gummi bears at a target.
One popular method for choosing a candidate model in design of experiments is to use stepwise selection. With stepwise selection, choosing a model depends on statistical significance. Terms with small p-values enter the model. If the entry of other terms makes the p-values large, then the terms exit the model.
Of course, we want to build your confidence, too. This means doing it wrong first, so you’re prepared for problems that arise in real life. Let’s see what happens if we put the blocks in the model, then consider just the main effects using Minitab Statistical Software’s default stepwise settings.
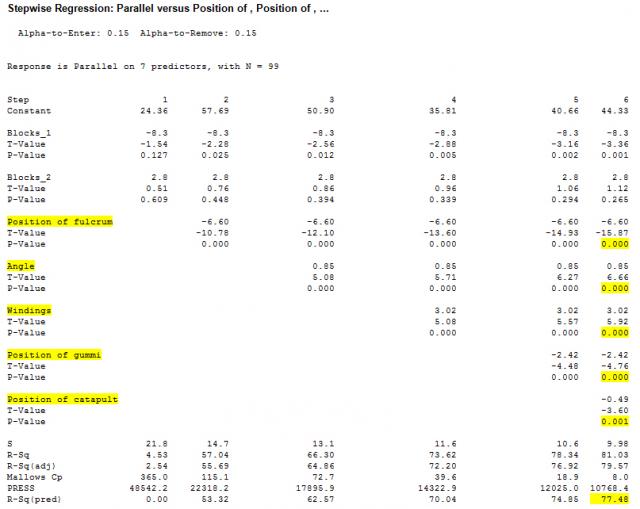
One of the main effects enters the model at each of the 6 steps. The effects are all highly statistically significant because the largest p-value is 0.001. The predicted R2 turns out to be 77.48%. This model looks pretty good.
But the second step is to check for reasons to discard the models. One of the checks you always do is look at the residual plots. Residual plots are not supposed to have patterns in them.
Here’s the plot of the residuals against the predictions from the main effects model:

See the nice way that curve fits? That indicates that the model tends to systematically underpredict close distances and long distances. Even though all of the terms are statistically significant, even though the predicted R2 is high, this is a model to discard.
Because we found the center points term to be statistically insignificant, a good guess to explain this curved pattern is that there is an interaction term that needs to be in the model. So what’s the next step in design of experiments? We include potential interactions in the stepwise procedure.
Here’s the final step:
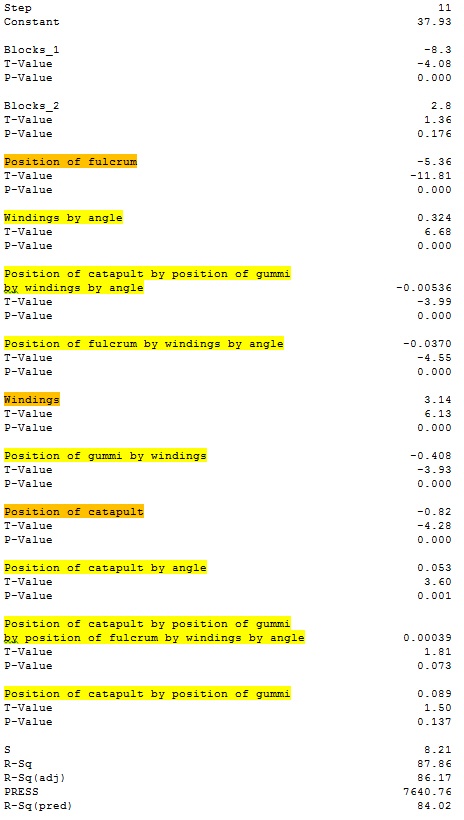
Main effects are in orange. Interactions are in yellow. The residuals for this model don’t show any obvious problems (take my word on it for now). Our predicted R-squared statistic got bigger. But there are some questions to ask. Is it reasonable to think that the best model will include the interaction between all 5 main effects, but not the launch angle or the position of the gummi bear? Does the model need all of these terms to do a good job? Stepwise selection is just one way of arriving at a candidate model. Often, we’ll want to poke around some more before we’re done.
Going forward, we’ll talk about some statistics we can use to compare candidate models. Can’t wait? Check out our handy knowledgebase’s tip about how to interpret my favorite model selection statistic: Predicted R2.