


by Jasmin Wong, guest blogger
Part 1 of this two-part blog post discusses the issues and challenges in injection moulding and suggests using simulation software and the statistical method called Design of Experiments (DOE) to speed development and boost quality. This part presents a case study that illustrates this approach.
Preliminary Fill and Designed Experiment
This case study considers the example of a hand dispensing pump for a sanitiser bottle where the main areas of concern were warpage and the concentricity of the tube, as this had a critical impact on fit and functionality.
In this example, the first step was to carry out a preliminary fill, pack, cool and warp analysis to ensure that the part had no filling difficulties such as short shots or hesitation. DOE was then carried out and, since the areas of concern were warpage and concentricity, these were selected as the quality factor/responses.
Four control factors that affected warpage and concentricity were used to carry out the DOE: melt temperature, packing pressure, cooling time, and fill time. The factors levels are shown in the table below:
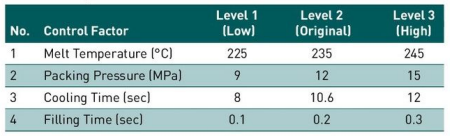
A Taguchi L9 DOE was then created using Minitab Statistical Software. It should be noted that a Taguchi DOE assumes no significant interaction between factors, but this may not necessarily be true. In this case, however, it was selected to determine the relationship between the factors and responses in the shortest simulation time.
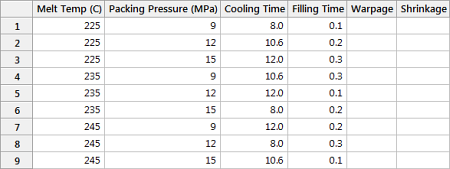
The Minitab worksheet below shows the process settings for the nine runs using the Taguchi L9 Design.
Moldex3D DOE was then used to perform the mathematical calculations based on the user’s specification (minimum warpage and linear shrinkage between nodes) to determine the optimum process setting.
From the nine different simulated runs, a main effect graph for warpage was plotted.
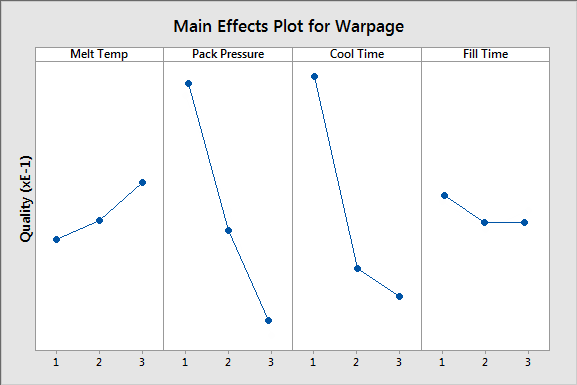
From this, it could be seen that by increasing the packing pressure and cooling time, warpage was reduced. Increasing melt temperature, on the other hand, lead to higher warpage. Using a filling time of 0.2s or 0.3s seemed to give slightly lesser warpage than 0.1s. Hence, it was determined that to achieve lower warpage, the optimum process setting should be a melt temperature of 225°C, packing pressure of 15MPa, cooling time of 12s and filling time of 0.3s.
Taking the results obtained from Moldex3D, Minitab Statistical Software was used to determine which of the four factors had the biggest influence on part warpage.
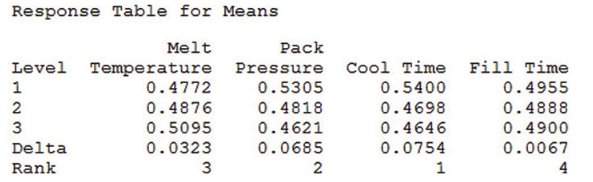
This data analysis showed that cool time had the biggest impact on part warpage, followed by packing pressure, melt temperature and then filling time. An area graph of warpage (PDF DOWNLOAD CHART 1) showed a quick comparison of the nine different runs, indicating that run 3 gave the least warpage.

Concentricity is difficult to measure, in both real life and in simulation. In real life, the distance between different points is measured using a coordinate-measuring machine (CMM). In the Moldex3D simulation, the linear shrinkage between different nodes was measured. Eight different nodes were identified. The linear shrinkage of the diameter of the tube across was determined and the lower the linear shrinkage, the more circular or better concentricity of the part.
The main effects plot below for shrinkage shows that to get better concentricity/linear shrinkage between the nodes, a lower melt temperature, cooling time and filling time with a high pack pressure was preferable.
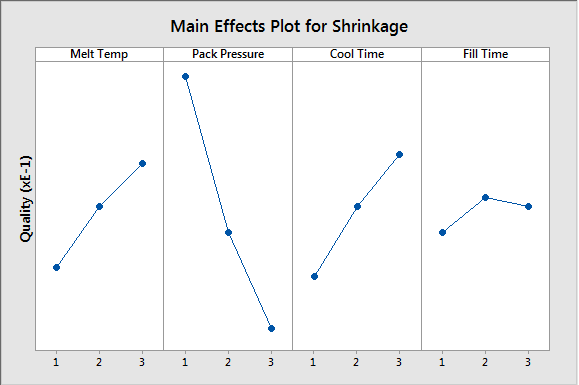
It had already been established that to achieve lower linear shrinkage, the optimum process setting should be melt temperature of 225°C, packing pressure of 15MPa, cooling time of 8s and filling time of 0.1s. However, a cooling time of 8s may not be practical, as the analysis of warpage shows it would give high warpage.
Minitab was also used to find out which of the four control factors resulted in the greatest impact on linear shrinkage.
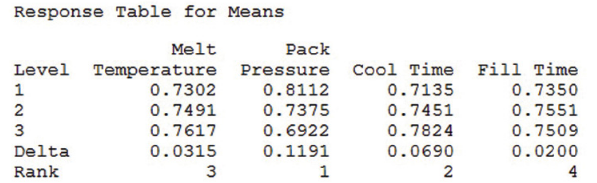
This showed that pack pressure is ranked first, followed by cooling time, melt temperature and lastly the filling time. Since the 8s cooling time would lead to high warpage, a compromise had to be made.
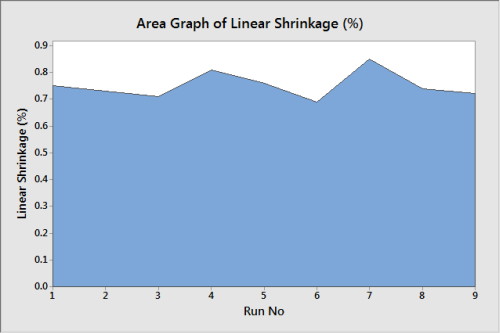
As mentioned earlier, for linear shrinkage the packing pressure was more of a contributing factor than the cooling time, so it makes sense to use 12s cooling time with 15MPa packing pressure. Comparing the nine different runs for linear shrinkage in an area graph showed that run six gave the lowest linear shrinkage.
Based on the user specification, Moldex3D’s mathematical calculations obtained the optimised run. For this example, weighting for warpage was the same as for linear shrinkage. However, based on the DOE simulation results obtained, the optimum process setting for the lowest warpage was to have a cooling time of 12s and filling time of 0.3s. The optimum process for the lowest linear shrinkage, on the other hand, required a cooling time of 8s and fill time of 0.1s.
Concluding thoughts
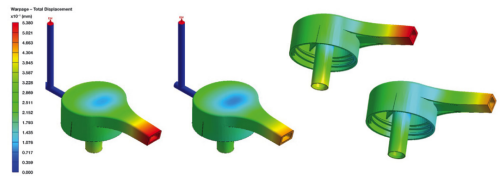
Moldex3D simulation resulted in a compromise process setting (melt temperature of 225°C, packing pressure of 15MPa, cooling time of 12s and filling time of 0.1s), which was used as the optimum run. From the area graphs shown below, it can be seen that the optimised run 10 gives the lowest warpage compared to the other nine runs, while having low linear shrinkage.
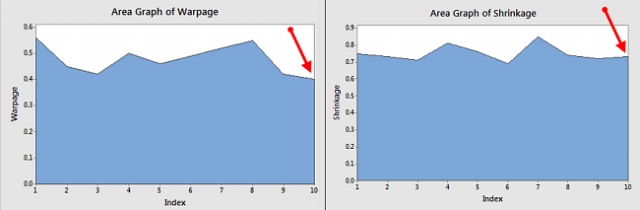
From the simulation in Moldex 3D, shown below, it can be seen that part warpage and concentricity of the tube has been significantly improved (warpage has been improved by 20-30% while linear shrinkage has been kept to 0.6-0.7%).
It is important that designers and moulders understand that numerical results in a simulation such as this provide only a relative comparison and should not be treated as absolute. This is because there are various uncontrollable factors in the actual mould shop environment—‘noise’—which cannot be re-enacted in a simulation. However, running DOE using simulation can give the engineering team a head start on identifying which control factors to focus on and the relationship those factors have with part quality.
About the guest blogger
Jasmin Wong is project engineer at UK-based Plazology, which provides product design optimisation, injection moulding fl ow simulation, mould design, mould procurement, and moulding process validation services to global manufacturing customers. She is an MSc graduate in polymer composite science and engineering and recently gained Moldex3D Analyst Certification.
A version of this article originally appeared in the October 2012 issue of Injection World magazine.