


As a person who loves baking (and eating) cakes, I find it bothersome to go through all the effort of baking a cake when the end result is too dry for my taste. For that reason, I decided to use a designed experiment in Minitab to help me reduce the moisture loss in baked chocolate cakes, and find the optimal settings of my input factors to produce a moist baked chocolate cake. I’ll share the details of the design and the results in this post.
Choosing Input Factors for the Designed Experiment
Because I like to use premixed chocolate cake mixes, I decided to use two of my favorite cake mix brands for the experiment. For the purpose of this post, I’ll call the brands A and B. Thinking about what could impact the loss of moisture, it is likely that the baking time and the oven temperature will affect the results. Therefore, the factors or inputs that I decided to use for the experiment are:
- Cake mix brand: A or B (categorical data)
- Oven temperature: 350 or 380 degrees Fahrenheit (continuous data)
- Baking time: 38 or 46 minutes (continuous data)
Measuring the Response
Next, I needed a way to measure the moisture loss. For this experiment, I used an electronic food scale to weigh each cake (in the same baking pan) before and after baking, and then used those weights in conjunction with the formula below to calculate the percent of moisture lost for each cake:
% Moisture Loss = 100 x initial weight – final weight
initial weight
Designing the Experiment
For this experiment, I decided to construct a 23 full factorial design with center points to detect any possible curvature in the response surface. Since the cake mix brand is categorical and therefore has no center point between brand A and brand B, the number of center points will be doubled for that factor. Because of this, I’d have to bake 10 cakes which, even for me, is too many in a single day. Therefore, I decided to run the experiment over two days. Because differences between the days on which the data was collected could potentially introduce additional variation, I decided to add a block to the design to account for any potential variation due to the day.
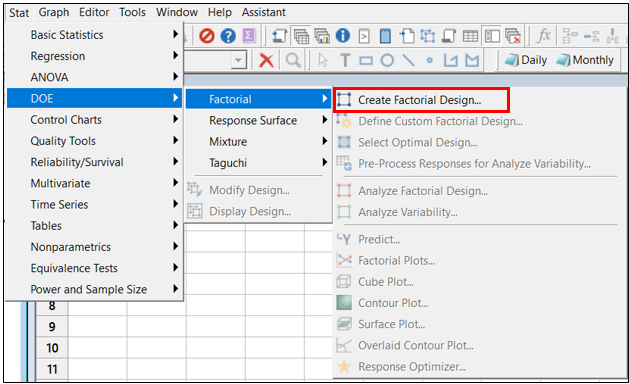
To create my design in Minitab, I use Stat > DOE > Factorial > Create Factorial Design:
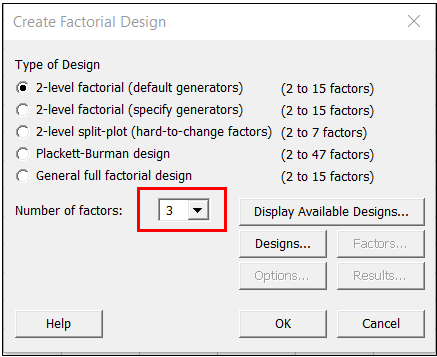
Minitab makes it easy to enter the details of the design. First, I selected 3 as the number of factors:
Next, I clicked on the Designs button above. In the Designs window, I can tell Minitab what type of design I’d like to use with my 3 factors:
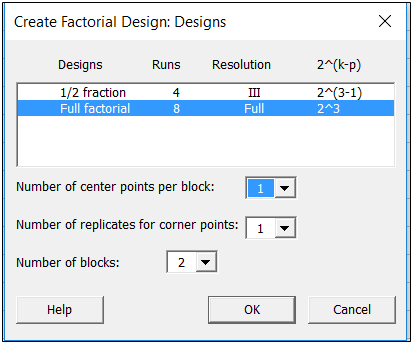
In the window above, I’ve selected a full 23 design, and also added 2 blocks (to account for variation between days), and 1 center point per block. After making the selections and clicking OK in the above window, I clicked on the Factors button in the main window to enter the details about each of my factors:
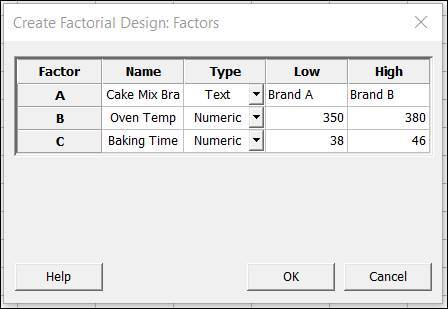
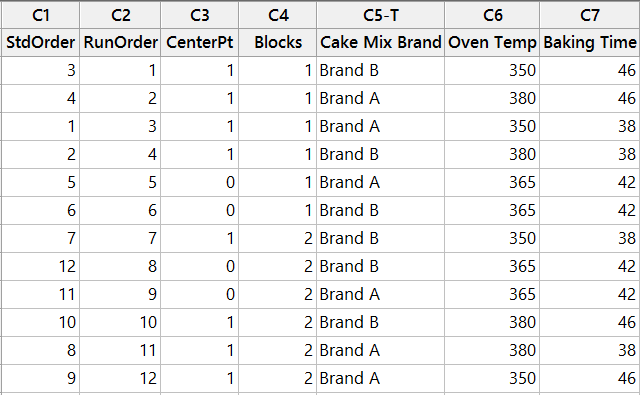
Because center points are doubled for categorical factors, and because this design has two blocks, the final design will have a total of 4 center points. After clicking OK in the window above, I ended up with the design shown below with 12 runs:
Performing the Experiment and Analyzing the Data
After spending an entire weekend baking cakes and calculating the moisture loss for each one, I entered the data into Minitab for the analysis. I also brought in a lot of cake to share with my colleagues at Minitab!
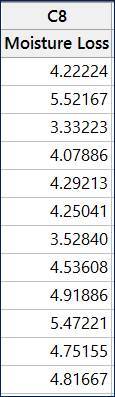
With the moisture loss for each of my 12 cakes recorded in column C8 in the experiment worksheet, I’m ready to analyze the results.
In Minitab, I used Stat > DOE > Factorial > Analyze Factorial Design... and then entered the Moisture Loss column in the Responses field:
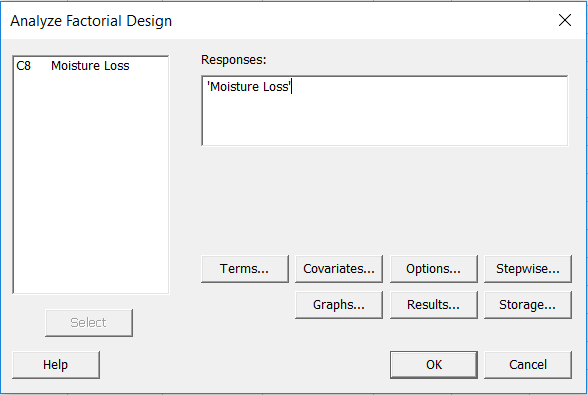
In the window above, I also clicked on Terms to make sure I’m only including the main effects and two-way interactions. After clicking OK in each window, Minitab produced a Pareto chart of the standardized effects that I could use to reduce my model:
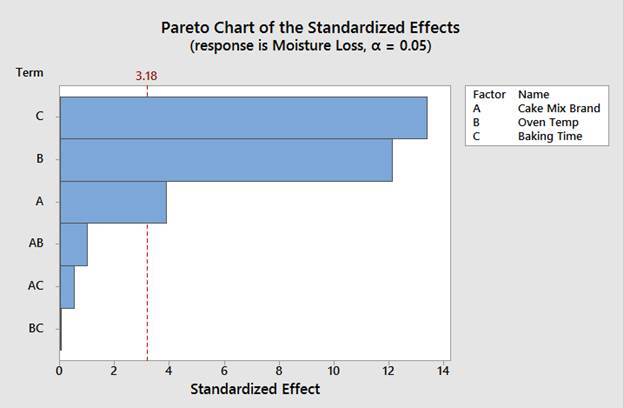
I can see from the above graph that the main effects (A, B and C) all significantly impact the moisture of the cake, since the bars that represent those terms on the graph extend beyond the red vertical reference line. All of the two-way interactions (AB, AC and BC) are not significant.
I can also see the same information in the ANOVA table in Minitab’s session window:
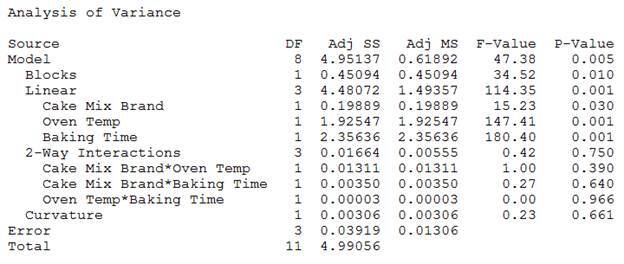
In the above ANOVA table, we can see that the cake mix brand, oven temp, and baking time are all significant since their p-values are lower than my alpha of 0.05.
We can also see that all of the 2-way interactions have p-values higher than 0.05, so I’ll conclude that those interactions are not significant and should be removed from the model.
Interestingly, the p-value for the blocks is significant (with a p-value of 0.01). This indicates that there was indeed a difference between the two days in which the data was collected which impacted the results. I'm glad I accounted for that additional variation by including a block in my design!
Analyzing the Reduced Model
To analyze my reduced model, I can go back to Stat > DOE > Factorial > Analyze Factorial Design. This time when I click the Terms button I’ll keep only the main effects, and remove the two-way interactions. Minitab displays the following ANOVA table for the reduced model:
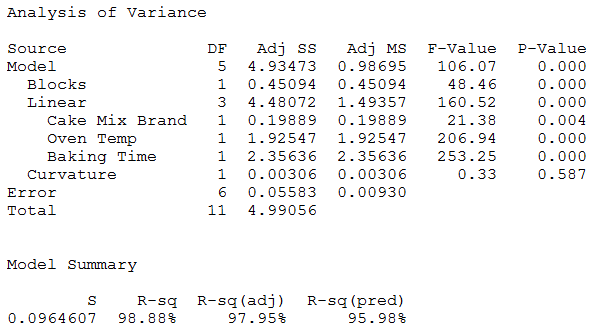
The table shows that all the terms I’ve included (mix brand, oven temp, and baking time) are significant since all the p-values for these terms are lower than 0.05. We can also see that the test for curvature based on the center points is not significant (p-value = 0.587), so we can conclude that the relationship between the three factors and moisture loss is linear.
The r-squared, r-squared adjusted, and r-squared predicted are all quite high, so this model seems to be a very good fit to the data.
Checking the Residuals
Now I can take a look at the residual plots to make sure all the model assumptions for my model have been met:
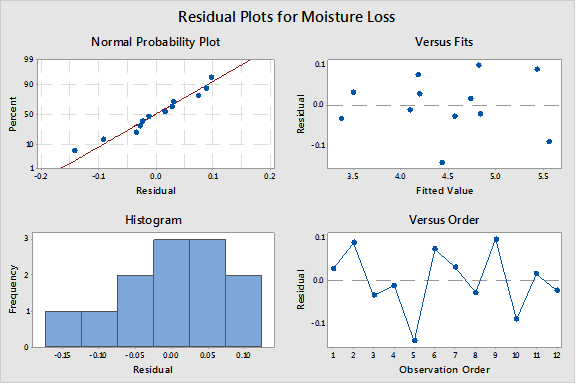
The residuals in the graph above appear to be normally distributed. The residuals versus fits graph appears to show the points are randomly scattered above and below 0 (which indicates constant variance), and the residuals versus order graph doesn’t suggest any patterns that could be due to the order in which the data was collected.
Now that I'm confident the assumptions for the model have been met, I’ll use this model to determine the optimal settings of my factors so that going forward all the cakes I make will be moist and fabulous!
Optimizing the Response
I can use Minitab’s Response Optimizer and my model to tell me exactly what combination of cake mix brand, oven temperature, and baking time I’ll want to use to get the moistest cake. I select Stat > DOE > Factorial > Response Optimizer:
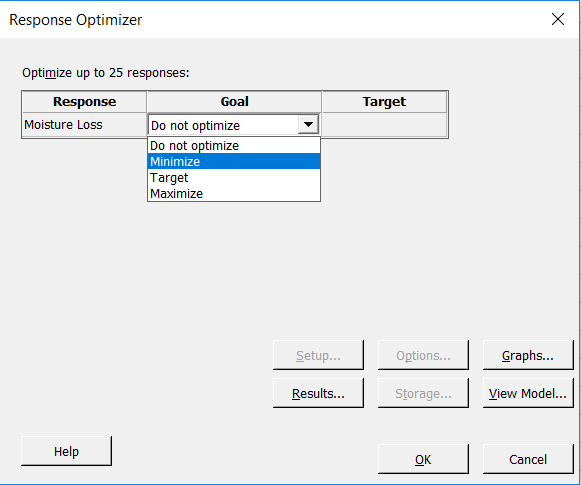
In the above window, I can tell Minitab what my goal is. In this case, I want to know what input settings to use so that the moisture loss will be minimized. Therefore, I choose Minimize above and then click OK:
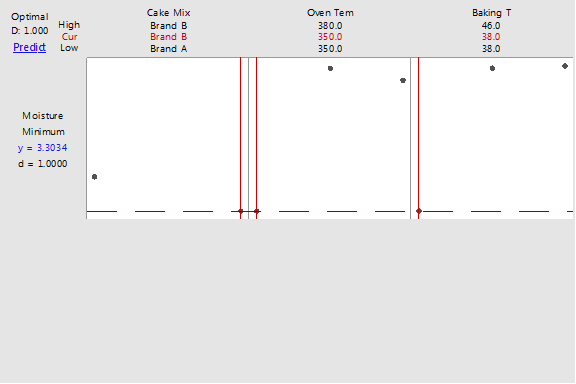
In the above graph, the optimal settings for my factors are marked in red near the top. Using the model that I’ve fit to my data, Minitab is telling me that I can use Brand B with an oven temperature of 350 and a baking time of 38 minutes to minimize the moisture loss. Using those values for the inputs, I can expect the moisture loss will be approximately 3.3034, which is quite low compared to the moisture loss for the cakes collected as part of the experiment.
Success! Now I can use these optimal settings, and I’ll never waste my time baking a dry cake again.
If you’ve enjoyed this post about DOE, you may also like to read some of our other DOE blog posts.