


Using data analysis and statistics to improve business quality has a long history. But it often seems like most of that history involves huge operations. After all, Six Sigma originated with Motorola, and became adopted by thousands of other businesses after it was adopted by a little-known outfit called General Electric.
There are many case studies and examples of how big companies used Six Sigma methods to save millions of dollars, slash expenses, and improve quality...but when they read about the big dogs getting those kind of results, a lot of folks hear a little voice in their heads saying, "Sure, but could it work in my small business?"
Can Six Sigma Help a Small Business?
 That's why I was so intrigued to find this article published in the TQM Journal in 2012: it shows exactly how Six Sigma methods can be used to benefit a small manufacturing business. The authors of this paper profile a small manufacturing company in India that was plagued with declining productivity. This operation made bicycle chains using plates, pins, bushings, and rollers.
The bushings, which need to be between 5.23 and 5.27 mm, had a very high rejection rate. Variation in the diameter caused rejection rates of 8 percent, so the company applied Six Sigma methods to reduce defects in the bushing manufacturing process.
The company used the DMAIC methodology--which divides a project into Define, Measure, Analyze, Improve, and Control phases--to attack the problem. Each step the authors describe in their process can be performed using Minitab Statistical Software and Minitab Engage, our software for executing and reporting on quality projects.
The Define Phase
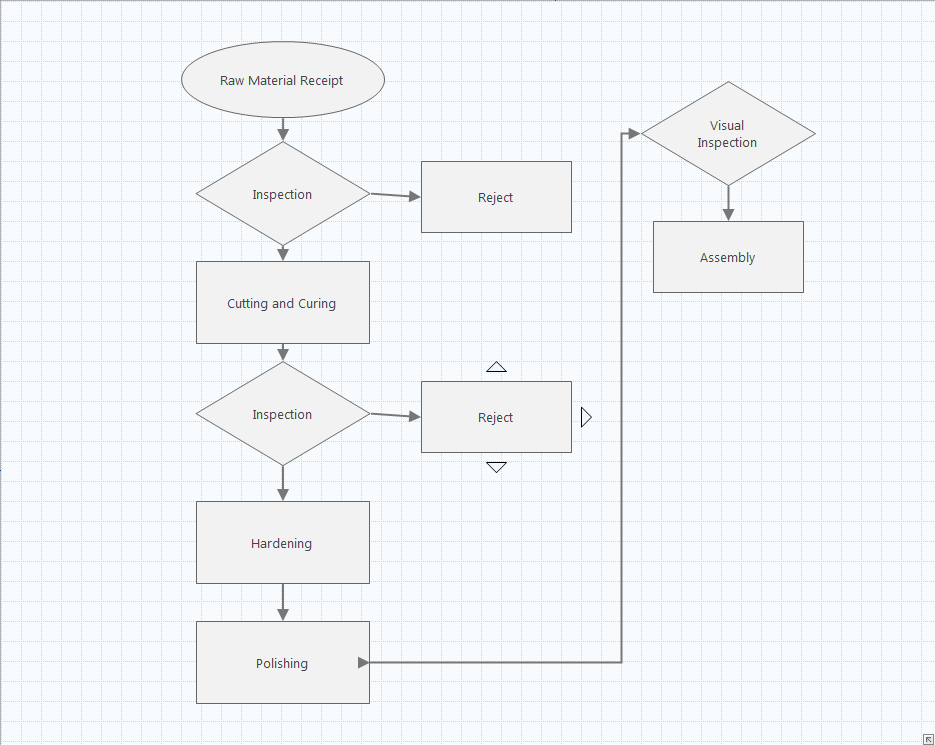
The Define phase is self-explanatory: you investigate and specify the problem, and detail the requirements that are not being met. In Define phase, the project team created a process map (reproduced below in Engage) and a SIPOC (Supplier, Input, Process, Output, Customer) diagram for the bushing manufacturing process.
The Measure Phase
In measure phase, you gather data about the process. This isn't always as straightforward as it seems, though. First, you need to make sure you can trust your data by conducting a measurement system analysis.
The team in this case study did Gage repeatability and reproducibility (Gage R&R) studies to confirm that their measurement system produced accurate and reliable data. This is a critical step, but it needn't be long and involved: the chain manufacturer's study involved two operators, who took two readings apiece on 10 sample bushings with a micrometer. The 40 data points they generated were sufficient to confirm the micrometer's accuracy and consistency, so they moved on to gathering data about the chain-making process itself.
The Analysis Phase
The team then applied a variety of data analysis tools, using Minitab Statistical Software. First they conducted a process capability analysis, taking 20 samples produced under similar circumstances (in groups of 5). The graph shown below uses simulated data with extremely similar, though not completely identical, results to those shown in the TQM Journal article.
One of the key items to look at here is the PPM Total, which equates to the commonly-heard DPMO, or defects per million opportunities. In this case, the DPMO is nearly 80,000 per million, or 8 percent.
Another measure of process capability is the the Z.bench score, which is a report of the process's sigma capability. In general terms, a 6 sigma process is one that has 3.4 defects per million opportunities. Adding the conventional 1.5 Z-shift, this appears to be about a 3-sigma process, or a little over 66,000 defects per million opportunities.
Clearly, there's a lot of room for improvement, and this preliminary analysis gives the team a measure against which to assess improvements they make to the process.
At this point, the project team looked carefully at the process to identify possible causes for rejecting bushings. They drew a fishbone diagram that helped them identify four potential factors to analyze: whether the operator was skilled or unskilled, how long rods were used (15 or 25 hours), how frequently the curl tool was reground (after 20 or 30 hours), and whether the rod-holding mechanism was new or old.
The team then used Minitab Statistical Software to do 2-sample t-tests on each of these factors. For each factor they studied, they collected 50 samples under each condition. For instance, they looked at 50 bushings made by skilled operators, and 50 made by unskilled operators. They also looked at 50 bushings made with rods that were replaced after 15 hours, and 50 made with rods replaced after 30 hours.
The t-tests revealed whether or not there was a statistically significant difference between the two conditions for each factor; if no significant difference existed, team members could conclude it didn't have a large impact on bush rejection.
This team's hypothesis tests indicated that operator skill level and curl-tool regrinding did not have a significant effect on bushing rejection; however, 15-hour vs. 25-hour rod replacement and new vs. old rod-holding mechanisms did. Thus, a fairly simple analysis helped them identify which factors they should their improvement efforts on.