


Whether you're drinking beer, cocktails, wine or water, nothing is more frustrating than sitting at a bar waiting for a bartender to take your order. With the price of a drink (especially where I live in New York City!) costing nearly as much as the hourly wage of each bartender, I’ve always wondered why bars consistently have people waiting.
A friend of mine owns a bar and explained that outside of knowing that Thursday, Friday and Saturday are his busiest days, it’s impossible to predict when people drink the most. He puts a pair of bartenders behind the bar in two shifts: the day shift from 12 p.m. to 8 p.m. and the night shift from 8 p.m. to 4 a.m. He estimates that his bartenders can make 300 drinks each during a shift, so that no one is waiting for a drink for more than 5 minutes.
30-day Free Trial: If you don't already have Minitab Statistical Software, download the trial here
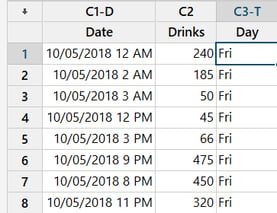
One Saturday night, after waiting what seemed like forever for my first drink, I demanded my friend show me his data — specifically the number of drinks he serves per day. He warned me that aside from collecting consistently at the end of the night, he only collected data points at certain times.
With data on my side, I decided to go behind the bar and began my investigation into why it took so long to get a drink!
I realized I first needed to figure out which days of the week are actually the busiest for the bar, so I quickly input his data into a Minitab worksheet and began my analysis.
Leveraging Pareto Chart: Which Days Do People Drink the Most?
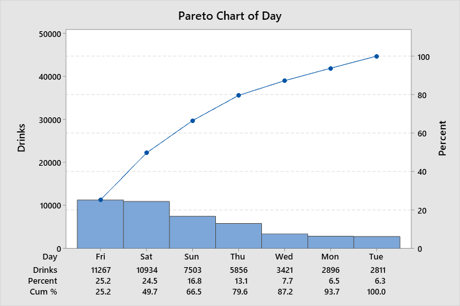
To start, I ran a simple Pareto chart to test my friend’s theory that Thursday, Friday and Saturday are the busiest days.
Not surprisingly, Friday and Saturday did top out as the busiest days at the bar. What my friend did learn, though, was that Sunday was even more important to his bar business than Thursday!
As much as I loved helping my friend, I was still determined to figure out why it was always taking so long for me to get a drink from his bar on a Saturday, so I narrowed my focus.
I believed either he didn’t have enough bartenders working or he had the wrong ones at the wrong time on Saturdays, but I was determined to get to the bottom of this.
Busting Out Boxplot Analysis:
Are You Sure You Don't Need Another Bartender?
He asked me to run some basic statistics that he had used to figure out his bartender lineup. So I ran some descriptive statistics:
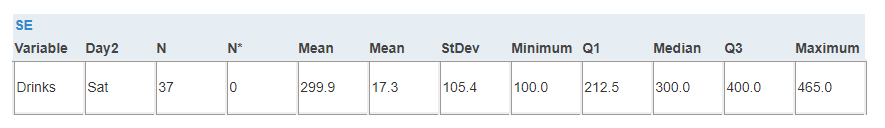
“You see!” he exclaimed. “I know my statistics too. The mean or average number of drinks per hour is 300 and even the median is 300. That’s why I plan for an average of 300 drinks per hour. I told you that you shouldn’t be waiting long!”
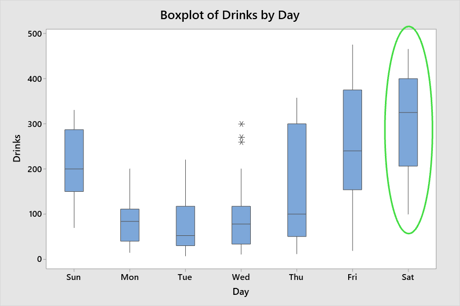
I knew I wasn’t imagining waiting forever for a drink, so I ran a boxplot analysis to show my friend that on Saturday, while the mean and median was ~300, it was pretty clear that there were plenty of times that his bartenders were being overwhelmed by the number of drinks per hour.
“Sure, I know they get busy sometimes. But that happens at random times,” my friend protested.
I was still not convinced that I always happened to be ordering a drink when demand was randomly spiking. It just did not make sense, so I knew there was another issue going on at the bar.
Using Individual Value Plot: What Are The Busiest Times?
I needed to see exactly at what times over 300 drinks were ordered at the bar, so I ran an individual value plot of drinks on Saturdays.
As I highlighted to my friend (seen below), despite the mean and median being ~300 on Saturdays, between 6 p.m. and 1 a.m., there were definitely more than 300 drinks being ordered.
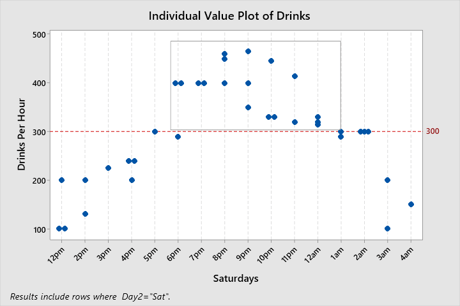 In fact, often times there were closer to 500 drinks being ordered rather than 300, which is nearly double. No wonder I was waiting so long!
The solution was simple: add a bartender from the hours of 6 p.m. to 1 a.m..
One of the late shift bartenders could show up two hours early and one of the first shift bartenders could stay two hours later. Problem solved!
Feeling like a glass of wine?
View our guide to learn how to consistently create your own vintage!
Improving Future Service and Staffing with Predictive Analytics
After all my work, my friend was still a bit skeptical and said: “Thanks to you and Minitab Statistical Software, I can understand the problem and solution. Still, how do I know this will play out in the future?”
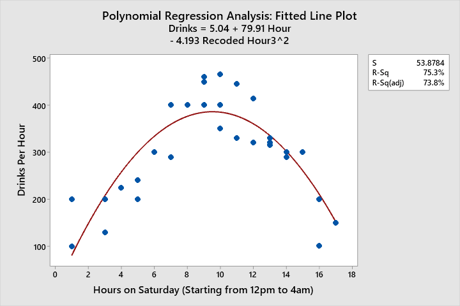 Easy! I ran a regression analysis for him to help him predict the amount of drinks that will be ordered on Saturday.
Based on the model, I was able to tell him that I would be able to predict the number of drinks per hour. With even more data, I was convinced I could predict even more accurately.
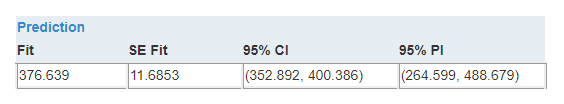
“How does that work?” He asked. “Let me see you predict how many drinks are served at 11 p.m.?”
So I ran my model through Minitab’s Predict command under the Stat Menu, under Regression.
It looks like you should expect ~377 drinks at 11 p.m.,” I explained.
Closing Out
After showing him 11 p.m., I ran another Predict.
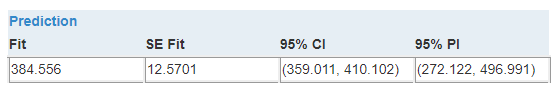
“What’s this one for?” my friend inquired.
“This one is for 8 p.m.. And it’s much more important than the information you had for 11 p.m.,” I explained.
“Why is the 8 p.m. model more statistically relevant than the 11 p.m. model?” My friend quickly asked.
“It’s really quite simple. 8 p.m. is usually when I’m at your bar trying to order a drink!